◎
Step inside the data
Experience depth and scale, and explore complex internal structures in three dimensions.
IMMERSIVE OBSERVATION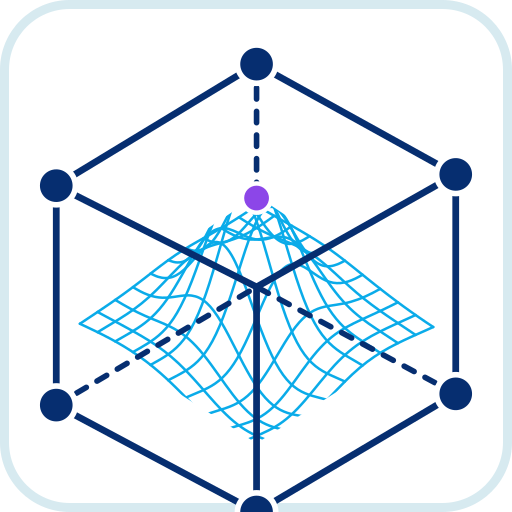 3D VR Visualization
THREE-DIMENSIONAL DATA EXPERIENCE
Dive into complex 3D data and look around. This virtual reality (VR) visualization system helps researchers understand spatial relationships intuitively.
Explore your 3D data from the inside.
Feel free to contact us!


This system uses core technology owned by the National Institute for Materials Science (NIMS). Penguin System Co., Ltd. implements and delivers the system to meet each customer’s needs.
The technology was developed by Yusuke Matsuoka of the Microstructure Thermodynamics Group, Materials Evaluation Field, Research Center for Structural Materials at NIMS. NIMS has filed a patent application (JP 2026-077064 A). Penguin System provides these system integration services under a patent license.
01 / WHY VR
BEYOND THE LIMITS OF 2D
Multicomponent phase diagrams, 3D microstructures and simulation results contain complex information. As the volume of data grows, rotating or zooming on a flat screen alone can make spatial relationships and internal structures difficult to grasp.
This system combines stereoscopic viewing through a VR headset with controller interaction, allowing researchers to experience their data as a space they can explore.
02 / CAPABILITIES
Experience depth and scale, and explore complex internal structures in three dimensions.
IMMERSIVE OBSERVATIONMove, zoom and inspect cross-sections. Use controllers to interact directly with your data as you explore.
INTERACTIVE ANALYSISConnect to external simulation software and other systems to visualize results in real time.
SYSTEM INTEGRATION03 / APPLICATIONS
 PHASE DIAGRAM
USE CASE
Explore ternary and quaternary phase diagrams in 3D. See how composition and temperature relate to phase regions, and understand complex phase boundaries intuitively.
04 / SYSTEM
Connect VR devices to your existing data and research environment.
MULTI-DEVICE READY
Support for multiple VR headsets. The device setup is tailored to your research environment and how you plan to use it.
 VR DEVICE
06 / CONTACT
TURN YOUR DATA INTO EXPERIENCE
Tell us about your data and research challenges.
Bring your data into 3D VR!